You Get Paid What? A Middle School Math Equity Lesson
You Get Paid What? A Middle School Math Equity Lesson
April 1, 2023
Michelle Everly
You Get Paid What?
Middle School Math Equity Lesson(s)
Teacher: Michelle Everly
Guiding Commitment Addressed: Advance Equity and Social Justice
Grade: 7th
Note: This lesson could be used for one long block scheduled class or a few shorter classes in a row. I think it would fit best after students were introduced to unit rates and proportionality in order to situate these two ideas within a real-world context.
Decide whether two quantities are in a proportional relationship, e.g., by testing for equivalent ratios in a table or graphing on a coordinate plane and observing whether the graph is a straight line through the origin.
CCSS.MATH.CONTENT.7.RP.A.2.B
Identify the constant of proportionality (unit rate) in tables, graphs, equations, diagrams, and verbal descriptions of proportional relationships.
Learning Goals
I can identify unit rates from a table or a graph.
I can identify whether two quantities are proportional using a table or graph.
I can describe what a unit rate is.
I think critically about what it means to “make a living.”
I can look for instances of and apply my knowledge of proportions, unit rates, and budgets to the real world.
Warm-Up
Question on board: What would you do if someone gave you $1,000 right now?
Write out your plan for the $1,000 in your notebook on your own.
Discuss your plans with your tablemates.
Create a plan as a group for what you all would do with the $1,000.
After we all have had time to work on this, one student from each table will share their individual plan and then another student from each table will share their group’s plan.
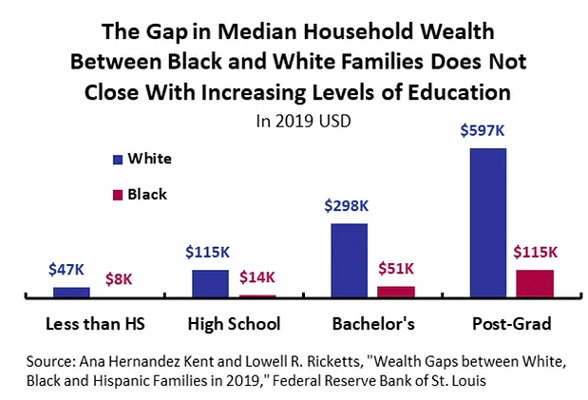
In table groups: What do you notice about this graph? What do you wonder?
To the whole class to be done in groups: Now, create a table for each line and include at least 4 data points for each table.
In groups
What is the unit rate for white wealth (as you get more educated)? What about black wealth?
Are the two situations proportional?
As a class: discuss what the differences in income mean for the different groups of people.
How did the unit rates help us when looking at this data?
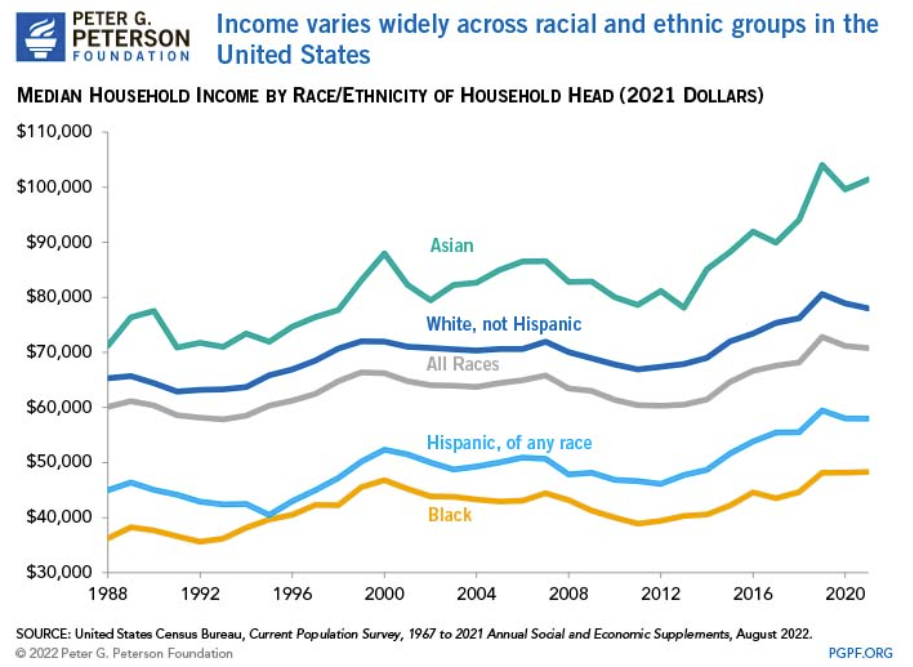
Have you all heard the phrase “make a living?” What do you think that means? How much do you think someone needs to make a living?
Supports
What does “household head” mean?
Activity 3 (individual or groups of 2)
After thinking through “making a living,” students will have 3 options to explore the idea of budgeting/making a living further.
Option 1: Research examples of proportional relationships in real life and choose one to make a poster, slideshow, drawing, or advertisement about.
Option 2: Create a budget for a family of 4 with an income of $55,000. Research costs of important items like housing, food, schooling, clothing, insurance, etc. What are your reactions to this process?
Option 3: Explore more of the income data on the Peter G. Peterson Foundation website. Create a graph of this data (it has to be one we did not already complete in class) and write a one-paragraph explanation about what you notice.
Summarize
After our independent/diad work time, we will come together to discuss what we learned throughout this lesson:
How do unit rates help us in real life?
Does proportionality exist in the “real world?”
How can our income, or opportunities to attain a certain income, affect us?
Processing Time
This may bring up feelings or questions for students
Give them 5-10 minutes to write in their math journals about what they learned in this lesson, how they felt, or questions they have
Students can also pass a note to me about their questions/feelings/if they want to debrief about anything
Homework
If not completed in class, finish your independent/diad activities for homework.
Share with someone at home about what you learned today!